

A new report ranks neighbourhoods across the UK by year-on-year changes in property prices.
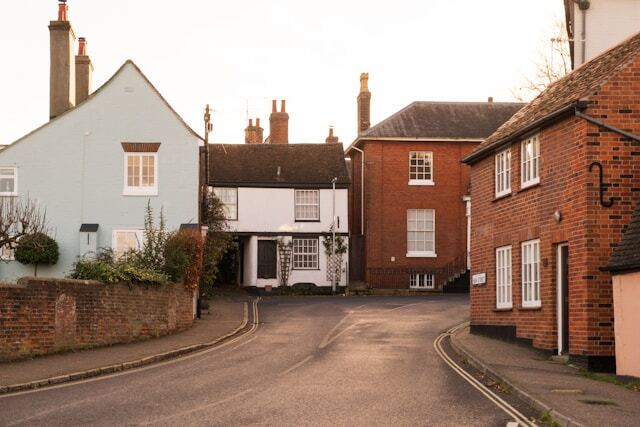
Photo taken by David Walker | Walker Design Co..
With well designed outdoor spaces often helping to improve a property's value, garden furniture company MG Timber and Online Marketing Surgery have created their House Growth Report, which ranks neighbourhoods in the UK based on their house price percentage change from September 2024 to September 2025.
Key Findings:
🏠 Central Solihull and Sharman’s Cross in Solihull saw the highest increase in property prices with an 81.3% increase.
🏠 The area with the highest property price decrease is St John’s Wood in Westminster with a 50% decrease.
Top 10 neighbourhoods with the highest increase in property prices
|
Area |
Local Authority |
Property Price Median (year ending September 2024) |
Property Price Median (year ending September 2025) |
Percentage Increase (September 2024/ September 2025) |
|
Central Solihull & Sharman’s Cross |
Solihull |
£320,000 |
£580,000 |
81.3% |
|
Newcastle Town |
Newcastle-under-Lyme |
£90,000 |
£154,688 |
71.9% |
|
South Tottenham |
Haringey |
£525,000 |
£900,000 |
71.4% |
|
Elswick South |
Newcastle upon Tyne |
£129,000 |
£207,995 |
61.2% |
|
Bishop Auckland North & Coundon Grange |
County Durham |
£87,000 |
£140,000 |
60.9% |
|
Strawberry Hill |
Richmond upon Thames |
£557,500 |
£880,000 |
57.8% |
|
Bensham North |
Gateshead |
£92,750 |
£145,000 |
56.3% |
|
Norwood Green South |
Ealing |
£415,000 |
£648,000 |
56.1% |
|
Golders Green South |
Barnet |
£950,000 |
£1,480,000 |
55.8% |
|
Broughton West |
Salford |
£173,750 |
£270,000 |
55.4% |
Top 10 neighbourhoods with the highest decrease in property prices
|
Area |
Local Authority |
Property Price Median (year ending September 2024) |
Property Price Median (year ending September 2025) |
Percentage Decrease (September 2024/ September 2025) |
|
St John’s Wood North |
Westminster |
£1,500,000 |
£750,000 |
50.0% |
|
Old Oak & Wormwood |
Hammersmith and Fulham |
£1,208,460 |
£611,000 |
49.4% |
|
Walsall East |
Walsall |
£305,000 |
£175,000 |
42.6% |
|
Church Street |
Westminster |
£872,500 |
£525,000 |
39.8% |
|
Ravenscourt Park South |
Hammersmith and Fulham |
£907,500 |
£550,000 |
39.4% |
|
Barkerend West & Little Germany |
Bradford |
£130,000 |
£82,000 |
36.9% |
|
Old Street & St Luke’s |
Islington |
£974,530 |
£620,000 |
36.4% |
|
Chadwell Heath South West |
Redbridge |
£450,000 |
£287,500 |
36.1% |
|
Barnack, Wittering & Wansford |
Peterborough |
£350,000 |
£225,000 |
35.6% |
|
Queens Park |
Brent |
£1,075,000 |
£700,000 |
34.9% |
Methodology:
- We used property data from the Office for National Statistics, which looked at the median house prices for MSOA areas in September 2024 and September 2025. We then worked out the highest increase and decrease percentages from these two figures.
Kind Regards,
Liam Edwards